How Does NDVI Work? Understanding the Basics and Applications of Vegetation Monitoring (Updated 2026)
By Evan Achiron
Monitoring vegetation health is essential for agriculture, environmental science, forestry, and land management. One of the most valuable tools for assessing vegetation health remotely is the Normalized Difference Vegetation Index (NDVI). NDVI uses satellite and aerial imagery to help us see and measure plant health across large areas.
Platforms like SkyFi make NDVI data more accessible and actionable, enabling people in various fields to make informed decisions about crops, forests, and ecosystems. This article explores what NDVI is, how it works, and where it’s used.
Key Takeaways (TLDR)
What is NDVI?: The Normalized Difference Vegetation Index (NDVI) is a remote sensing metric used to quantify vegetation health by measuring how plants reflect specific bands of the electromagnetic spectrum.
The Science of Reflection: Healthy plants absorb most visible red light and reflect a high amount of near-infrared (NIR) light. Stressed or sparse vegetation reflects more red light and less NIR.
Precision Agriculture Benefits: Farmers use NDVI for Variable Rate Application (VRA), allowing them to optimize fertilizer and water usage by targeting only the areas of a field that show signs of stress.
Global Applications: Beyond farming, NDVI is critical for monitoring deforestation, tracking ecosystem recovery after wildfires, and predicting drought risks on a global scale.
Data Collection Tools: NDVI data is primarily gathered via satellite imagery (for large-scale trends) and drones (for high-resolution, localized "precision" scouting).
What is the Normalized Difference Vegetation Index (NDVI)?
NDVI is a remote sensing index that calculates the health of vegetation based on how plants reflect ranges of the electromagnetic spectrum, also known as bands. This spectrum is fundamental to the interpretation of NDVI, as it allows a plant’s health to be depicted based on how it reflects both energy and light.
Monitoring Near-Infrared Light
Healthy vegetation has a unique light signature: it reflects more near-infrared (NIR) light, or waves, while absorbing visible red light, or waves. Stressed or sparse vegetation, on the other hand, reflects more red light. NDVI converts this difference into an index, making it possible to monitor plant health on a scale that would otherwise be impossible.
Monitoring Chlorophyll Levels
NDVI also differentiates a healthy plant from a diseased one based on the relationship between chlorophyll and light. A healthy plant undergoes photosynthesis at a much more efficient rate, which means it contains more chlorophyll. The more chlorophyll and overall cell structures, the more NIR light is reflected, and the more red light is absorbed.
In simple terms, NDVI gives a snapshot of plant health based on how each pixel in a satellite image interacts with wavelengths of light, making it a reliable tool for assessing vegetation density and vitality across landscapes.
NDVI through the years
The concept of NDVI was introduced in 1973 by a research team at Texas A&M University as one of the earliest vegetation indexes, allowing scientists to monitor plant health on a large scale. Initially used in agricultural research, NDVI gained global popularity with the rise of satellite technology in the 1980s, enabling regular monitoring of vegetation changes across regions.
Today, with improved satellite and drone technologies, NDVI data is collected at high resolution and used for real-time vegetation monitoring, making it more accessible than ever before.
Understanding the NDVI Formula
The NDVI determines the health of a plant by comparing the values of absorption and reflection of red and NIR light. The following formula calculates the NDVI based on data recorded by a satellite:
NDVI = (NIR - Red) / (NIR + Red), yielding values between -1 and +1 to indicate vegetation health.
The formula subtracts the reflectance in the red spectral band from that of the NIR spectral band, and then divides that by the sum of the two. Values close to +1 indicate dense, healthy vegetation. Values near zero suggest minimal or unhealthy vegetation. Negative values often represent water or other non-vegetated surfaces. These values are used in satellite imaging, and a single value is determined for each individual pixel in a particular image.
Applications of NDVI: How It’s Used Across Different Fields
NDVI is a versatile tool applied across numerous sectors where vegetation health matters. Here are some of its primary applications:
1. Enhancing Crop Monitoring
In agriculture, NDVI is widely used to monitor crop health and detect signs of stress. NDVI values, when tracked over time, help farmers understand crop performance, spot nutrient deficiencies, and optimize resource use like water and fertilizer. By identifying problem areas early, farmers can take timely action to maintain yield quality and quantity.
2. Managing Forest Health and Density
Foresters use NDVI to assess forest density, detect disease outbreaks, and monitor deforestation or regeneration efforts. NDVI color maps help forest managers understand changes in biomass and track the effects of natural events, such as fires or insect infestations, on forest health.
3. Tracking Ecosystem Changes
Environmental scientists rely on NDVI to monitor ecosystems like grasslands, wetlands, and savannas. It helps detect changes caused by human activities, such as deforestation, and natural events, like droughts or floods. NDVI data supports conservation efforts by providing valuable insights into land use changes, ecosystem recovery, and climate impact.
How NDVI is Used in Agriculture: Key Practical Applications
In agriculture, NDVI has become a go-to tool for precision farming, allowing farmers to make data-driven decisions and optimize their operations. Here are some of the most practical uses of NDVI in this field:
Monitoring Crop Health Over Time
NDVI values are tracked throughout the growing season to assess crop health. By comparing seasonal NDVI data, farmers can identify trends, spot potential issues, and make adjustments to improve crop productivity.
Creating Variable Rate Application Maps
NDVI data can be used to create color maps that guide specific applications of water, fertilizer, and pesticides. This targeted approach reduces waste, lowers costs, and increases crop yield.
Improving Field Scouting Efficiency
Instead of manually inspecting entire fields, NDVI helps farmers focus on stressed areas by highlighting zones with low NDVI values. This targeted scouting approach saves time and minimizes crop disturbance.
Identifying Crop Stress Early
NDVI can detect stress in plants before it’s visible to the human eye, helping farmers address issues such as pest infestations or nutrient deficiencies early in the growing season.
Detecting Drought Risks
By analyzing NDVI over time, farmers and scientists can identify areas where vegetation health is declining, helping to pinpoint regions at risk of drought. This can support water management efforts and reduce the impact of dry spells on crop yield.
Technologies for Collecting NDVI Data
Several technologies are used to capture NDVI data, each offering its advantages depending on the size and scale of the area monitored:
Satellite Imagery
Satellite imagery provides extensive coverage, capturing NDVI data for large areas regularly. Platforms like SkyFi connect users with satellite data sources, making it easier to access NDVI data for different regions and scales.
Drones and Ground-Based Sensors
For smaller areas or high-resolution needs, drones and on-ground sensors are ideal. They allow for real-time NDVI data collection, offering greater flexibility and precision, especially when weather conditions impact satellite imagery.
Making Sense of NDVI Data in Agriculture: Analysis and Interpretation
Once collected, NDVI data can be analyzed in various ways to support agricultural practices and land management:
Visual Analysis
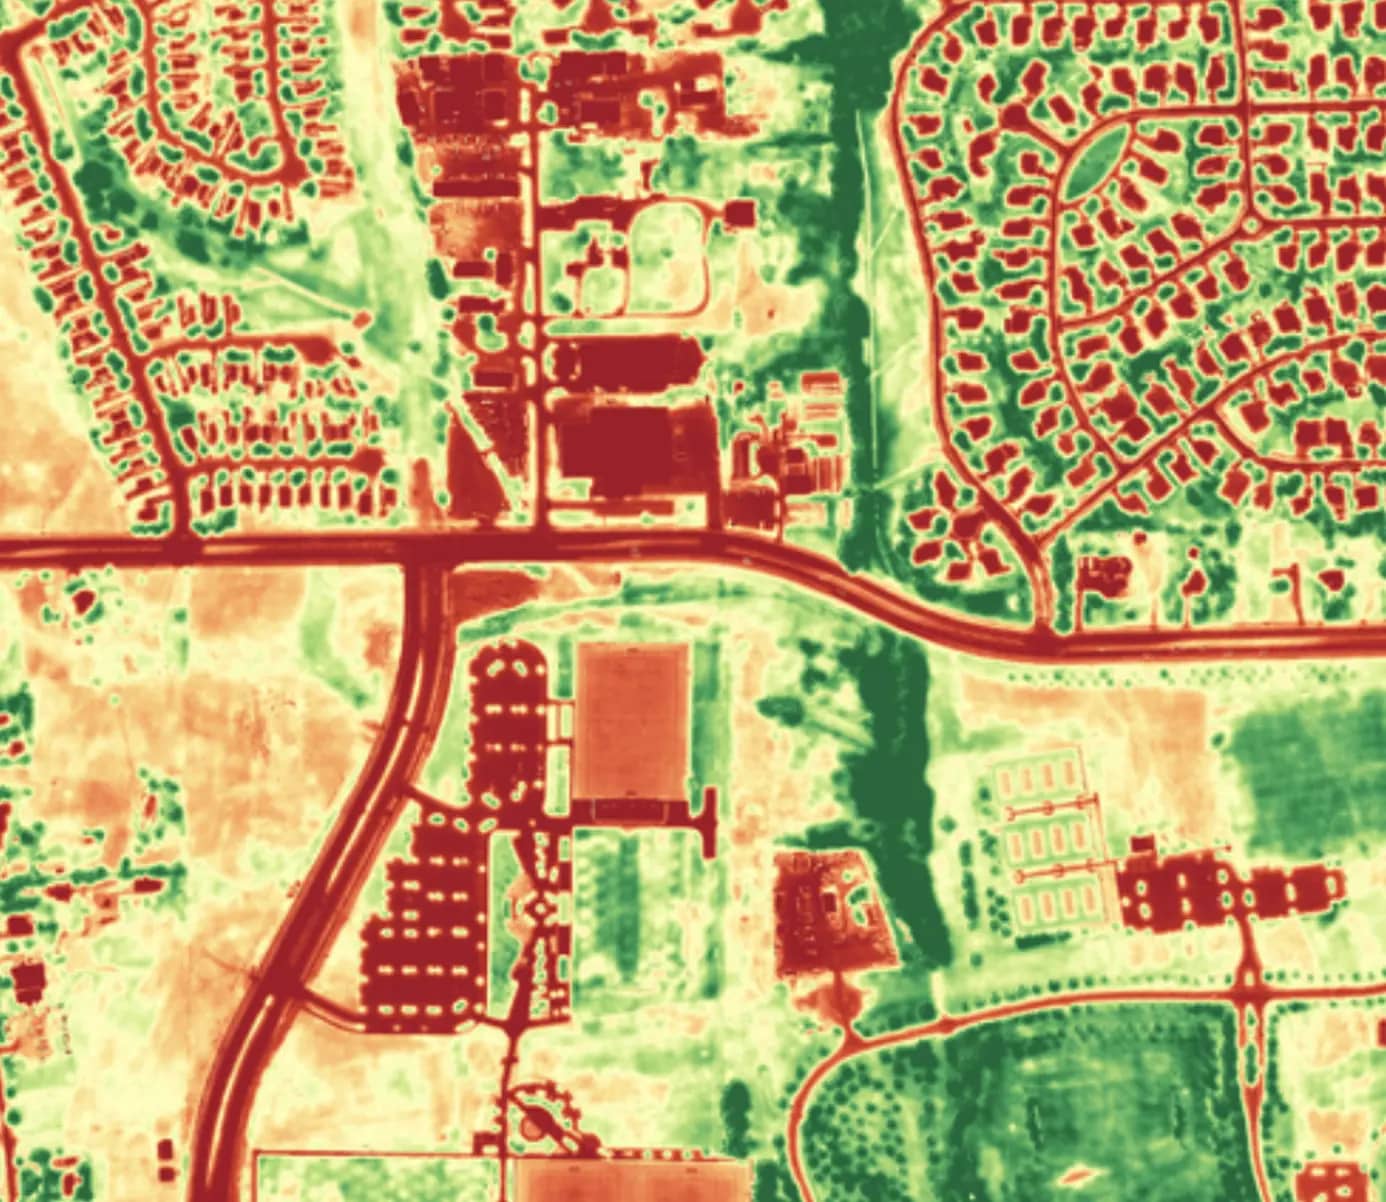
NDVI values can be represented on maps, where color-coded zones indicate levels of vegetation health. This visualization helps users quickly understand areas needing further investigation or management.
NDVI creates these maps based on data from satellite imaging, converting the data into unique NDVI values that come together to form a color map measuring vegetation type, quantity, and condition. The colors are determined by each pixel in a satellite image, with a value assigned to each pixel.
There are several color scales that can be used for color maps, but the most popular depicts high NDVI value areas with healthy vegetation in green, and is known as a “stoplight color map” due to its usage of red, yellow, and green to indicate varying vegetation health.
Statistical Analysis
NDVI data can be examined statistically to track trends, correlations, and relationships between NDVI values and yield outcomes. This analysis is crucial for long-term agricultural planning and risk assessment.
Machine Learning and Predictive Analysis
Using machine learning models, NDVI data can predict crop yields, assess future drought risk, or identify patterns over time. Machine learning enhances NDVI’s predictive power, making it even more valuable in precision agriculture.
Integrating with Other Data Sources
NDVI is often combined with weather data, soil health information, and historical yields to create a complete picture of the factors impacting vegetation health. This multi-layered approach enhances decision-making and resource optimization.
Limitations of NDVI
While NDVI is highly useful, it does have limitations:
Atmospheric interference: Clouds, haze, and other atmospheric conditions can reduce NDVI accuracy.
Difficulty distinguishing vegetation types: NDVI may not differentiate well between types of vegetation or fine differences in health.
Calibration errors: Inaccurate measurements from NDVI tools can occur due to sensor and calculation issues
Orbital overpass time: The angle of the sun will shift depending on what time of day it is, so different parts of vegetation will be illuminated depending on when the satellite passes through.
Despite these limitations, NDVI remains a vital tool for monitoring plant health and ecosystem dynamics. When combined with other data sources, these challenges can be mitigated, providing a more comprehensive view of vegetation conditions.
Latest NDVI News
A January 2026 study indicates that long-term NDVI analysis revealed that increased vegetation in East Asia led to a 32.5% decrease in dust emissions since the early 2000s. This trend is expected to continue through the year 2021. Healthy vegetation in regions with mostly sparse vegetation provide the greatest mitigation by stabilizing land surface and preventing long-term emissions.
NDVI was also utilized in another January 2026 study exploring changes in land use and vegetation cover in a province of Algeria. NDVI analysis depicted a massive decline in vegetation cover, from 42% in 1987 to 10% in 2020, a 32% decrease, while urban areas expanded by 27%. This reduction was ultimately linked to a 22% decrease in rainfall and a 6.5% reduction in relative humidity.
The Future of NDVI and Vegetation Monitoring
With continued advancements in satellite technology and analytics, the future of NDVI is promising. Real-time NDVI monitoring and higher-resolution imagery are becoming more accessible, making it easier for farmers, researchers, and environmentalists to monitor vegetation health accurately and efficiently. SkyFi is at the forefront of this progress, connecting users with high-quality NDVI data and analysis tools, supporting sustainable practices in agriculture, conservation, and beyond.
NDVI FAQs
How is NDVI measured?
NDVI is measured by sensors on satellites, drones, or ground-based equipment that detect red and near-infrared light reflected by vegetation.
How do you calculate NDVI?
The NDVI calculation is simple: NDVI = (NIR - Red) / (NIR + Red), yielding values between -1 and +1 to indicate vegetation health.
How do you interpret NDVI values?
Values close to +1 indicate dense, healthy vegetation.
Values near zero suggest minimal vegetation.
Negative values often represent water or other non-vegetated surfaces.
With tools like NDVI and platforms such as SkyFi, accessing and analyzing vegetation data has never been easier. NDVI continues to be an essential tool for understanding plant health, and with its expanding use, we gain better insights into land management, environmental conservation, and agricultural sustainability.
Sources:
https://www.sciencedirect.com/science/article/pii/S0034425723005151
https://www.nature.com/articles/s41467-026-68427-y
By Evan Achiron


