What Are Thermal Satellites and How Are They Used for High-Resolution Imagery?
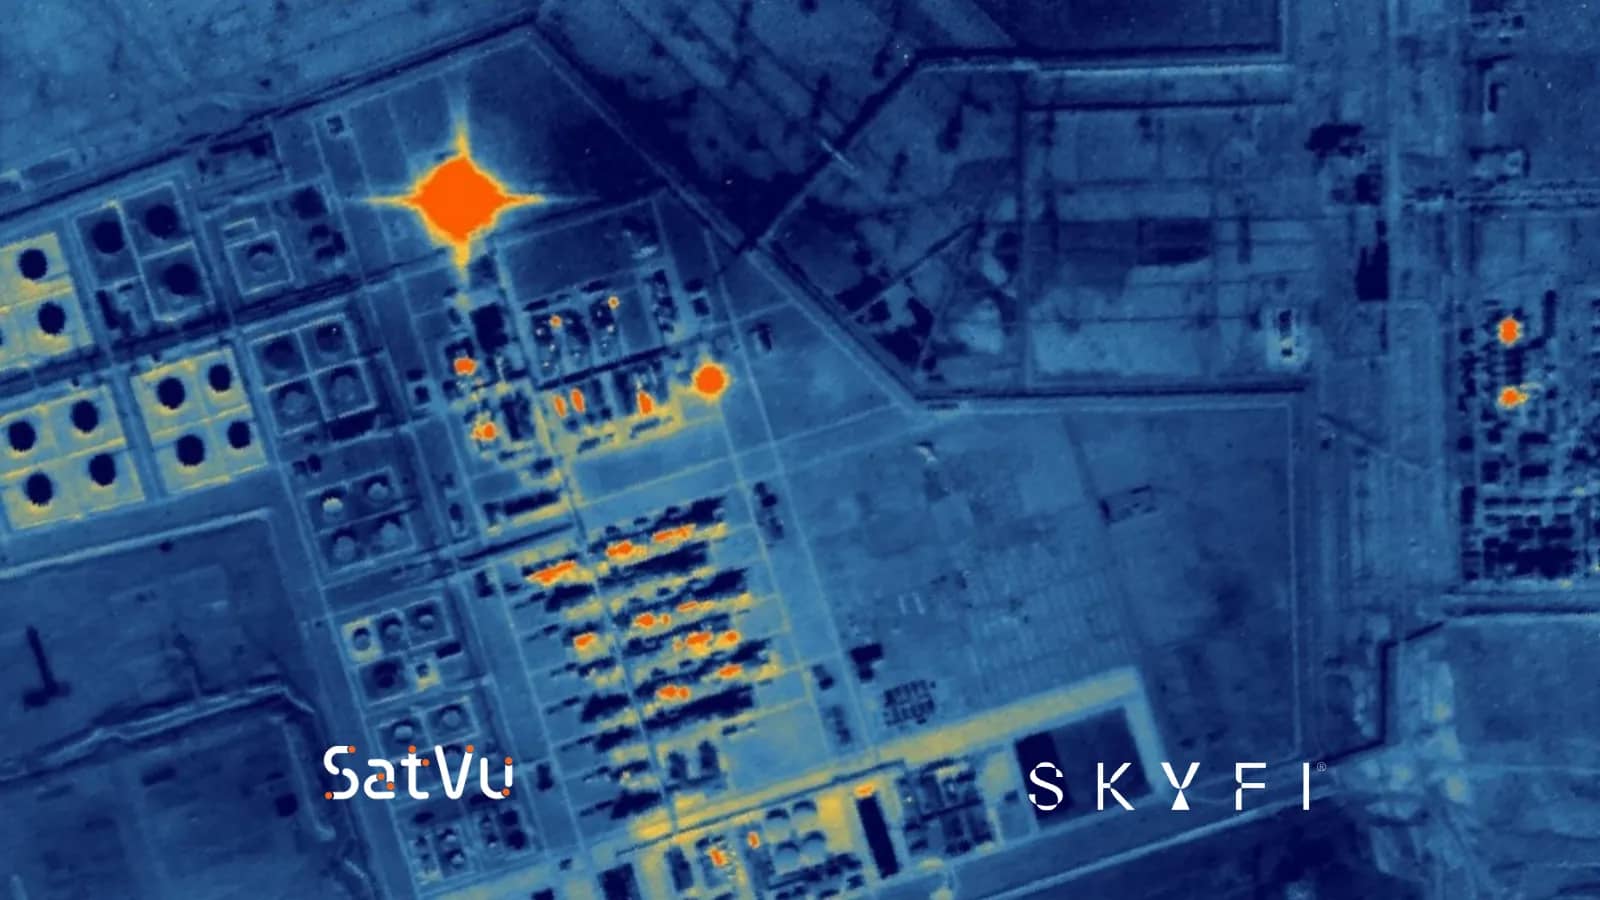
At 2 a.m., a refinery on the other side of the world looks dark in every optical image. A thermal sensor sees something different: flare stacks burning, storage tanks holding warm products, and a cooling water plume spreading into the river. Each heat signature tells an analyst whether the plant is running and whether something is wrong.
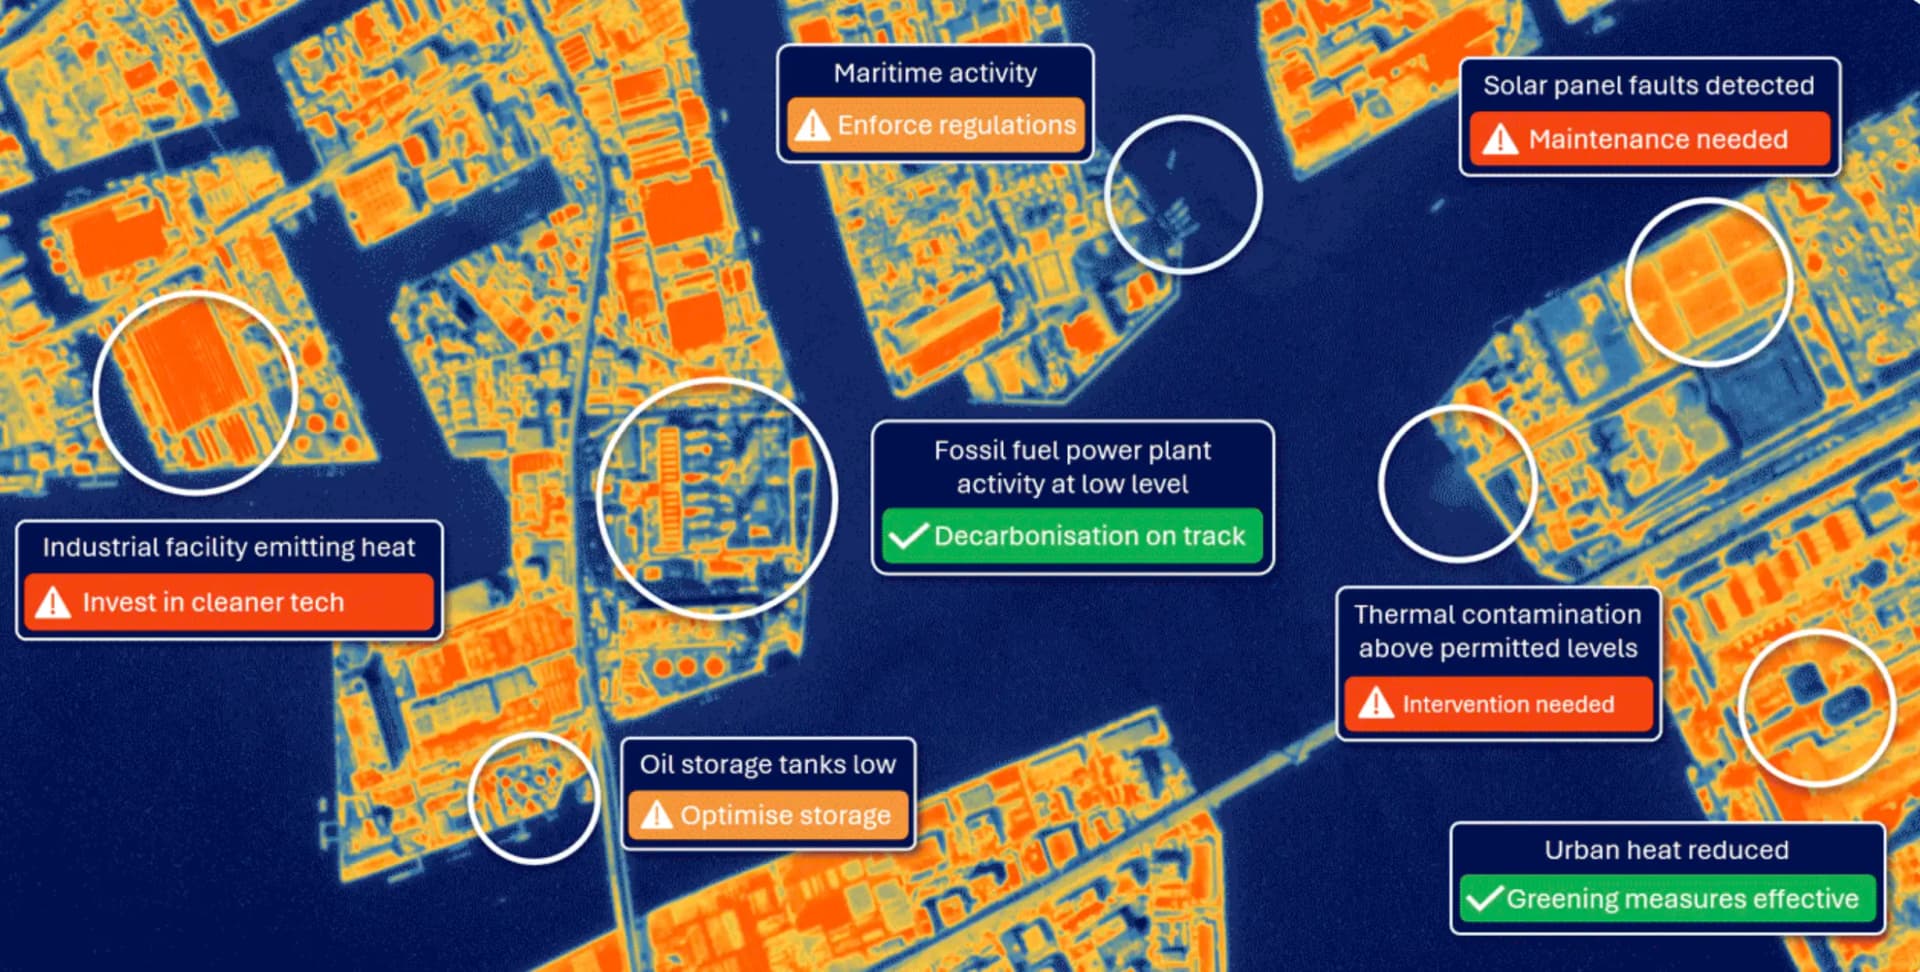
Heat is one of the most useful signals on Earth, and it is invisible to the human eye. Energy operators watch for overheating equipment and leaks. Insurers track wildfire risk. Investors want to know which factories are producing. Defense analysts need to know which vehicles have recently moved. All of them need to measure temperature, not just see color.
For years, the only thermal satellite data most teams could get came from free government missions like Landsat and MODIS. Those sources are valuable for regional trends, but their pixels measure 100 meters to 1 kilometer across, so a single pixel can blend a whole factory, its parking lot, and the field next door. Without finer thermal detail, a failing transformer, a smoldering stockpile, or a facility quietly restarting production goes unnoticed until the problem shows up somewhere else.
SkyFi changes that. The self-serve platform gives organizations direct access to high-resolution thermal satellite imagery from SatVu and constellr, alongside optical and SAR data, with no minimum commitments and delivery in under 24 hours. This guide covers how thermal satellites work, how eight industries use them, and what sets SkyFi apart as a thermal satellite imagery app.
What Are Thermal Satellites?
Thermal satellites carry infrared sensors that measure the heat energy the Earth's surface emits. Every object above absolute zero gives off infrared radiation, and warmer objects give off more. A thermal sensor converts that radiation into a temperature map, where hot surfaces such as engines, rooftops, and industrial stacks stand out from cooler surroundings like water and vegetation.
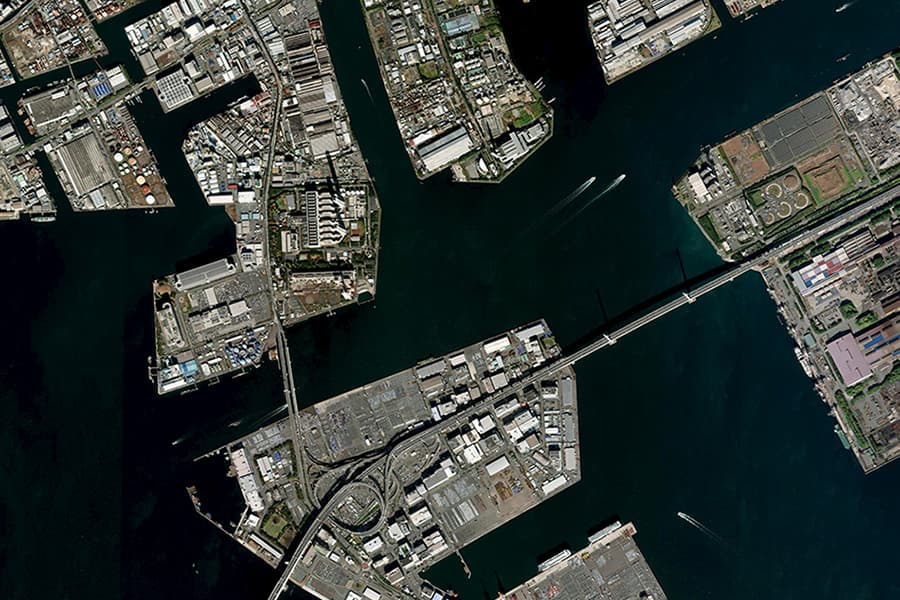
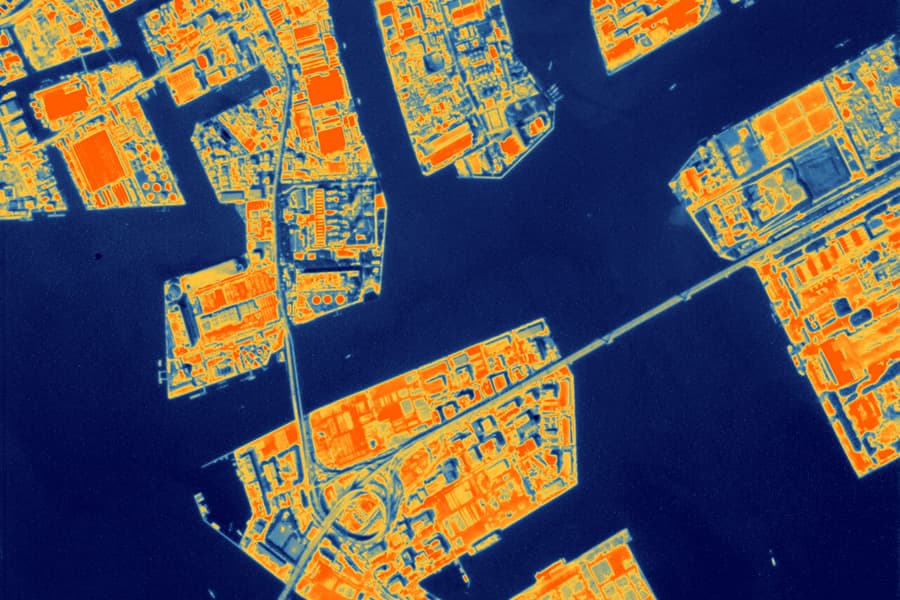
Because the sensor reads heat the surface emits rather than sunlight it reflects, thermal imaging satellites can collect useful data at night. That makes thermal remote sensing satellites one of the few sources that can watch activity around the clock.
Thermal Infrared Bands and What Each Is For
Thermal imagery is captured in specific ranges of the infrared spectrum, and each range suits different use cases:
Band | Wavelength | Best for |
Mid-wave infrared (MWIR) | 3,000 to 5,000 nm | Hot targets such as fires, flares, engines, and industrial processes, especially at night |
Thermal infrared (TIR, or long-wave) | 8,000 to 15,000 nm | Measuring surface temperatures to monitor urban heat, agricultural water stress, water temperatures, and environmental changes |
Visible and near-infrared (VNIR) | 400 to 1,100 nm | Providing visual and spectral context for thermal imagery, including vegetation health, land cover, and surface features |
SkyFi offers thermal satellite imagery from two fully integrated providers:
Provider | Resolution | Bands | Revisit | Best for |
SatVu HotSat-1 and HotSat-2 | 3.5 m at nadir; 6.4 m at 45° off-nadir | MWIR (day and night) | Daily | Asset-level heat signatures and thermal video of individual facilities |
constellr SkyBee-1 and SkyBee-2 | 30 m thermal; 10 to 60 m VNIR | Four TIR bands plus ten VNIR bands | Sub-daily | Land surface temperature across fields, cities, and regions |
SatVu captures imagery with video-based imaging and forward motion compensation over a 4.5 km swath, producing the sharpest commercial thermal satellite imagery available on SkyFi. At 3.5 m, each pixel covers about 1/800th of the area of a 100 m Landsat thermal pixel. constellr images 15 by 15 km scenes or longer strips, pairing four thermal bands with ten visible and near-infrared bands so temperature and vegetation can be read from the same capture.
How Thermal Differs From Optical and SAR
Optical imagery records reflected sunlight and shows what a place looks like. SAR sends out microwave pulses and reveals structure and surface change through any weather. Thermal imagery measures how hot things are, which neither of the other two can do. While an optical image cannot distinguish a parked truck from one with a recently turned-off engine, a thermal image reveals the difference through its thermal signature.
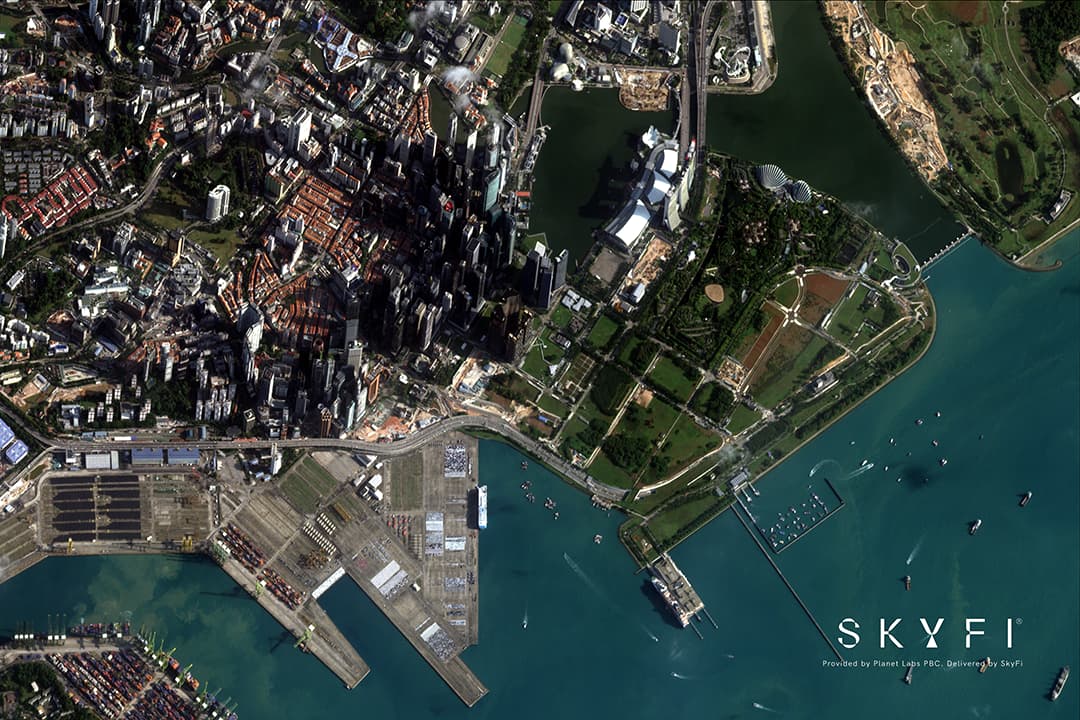
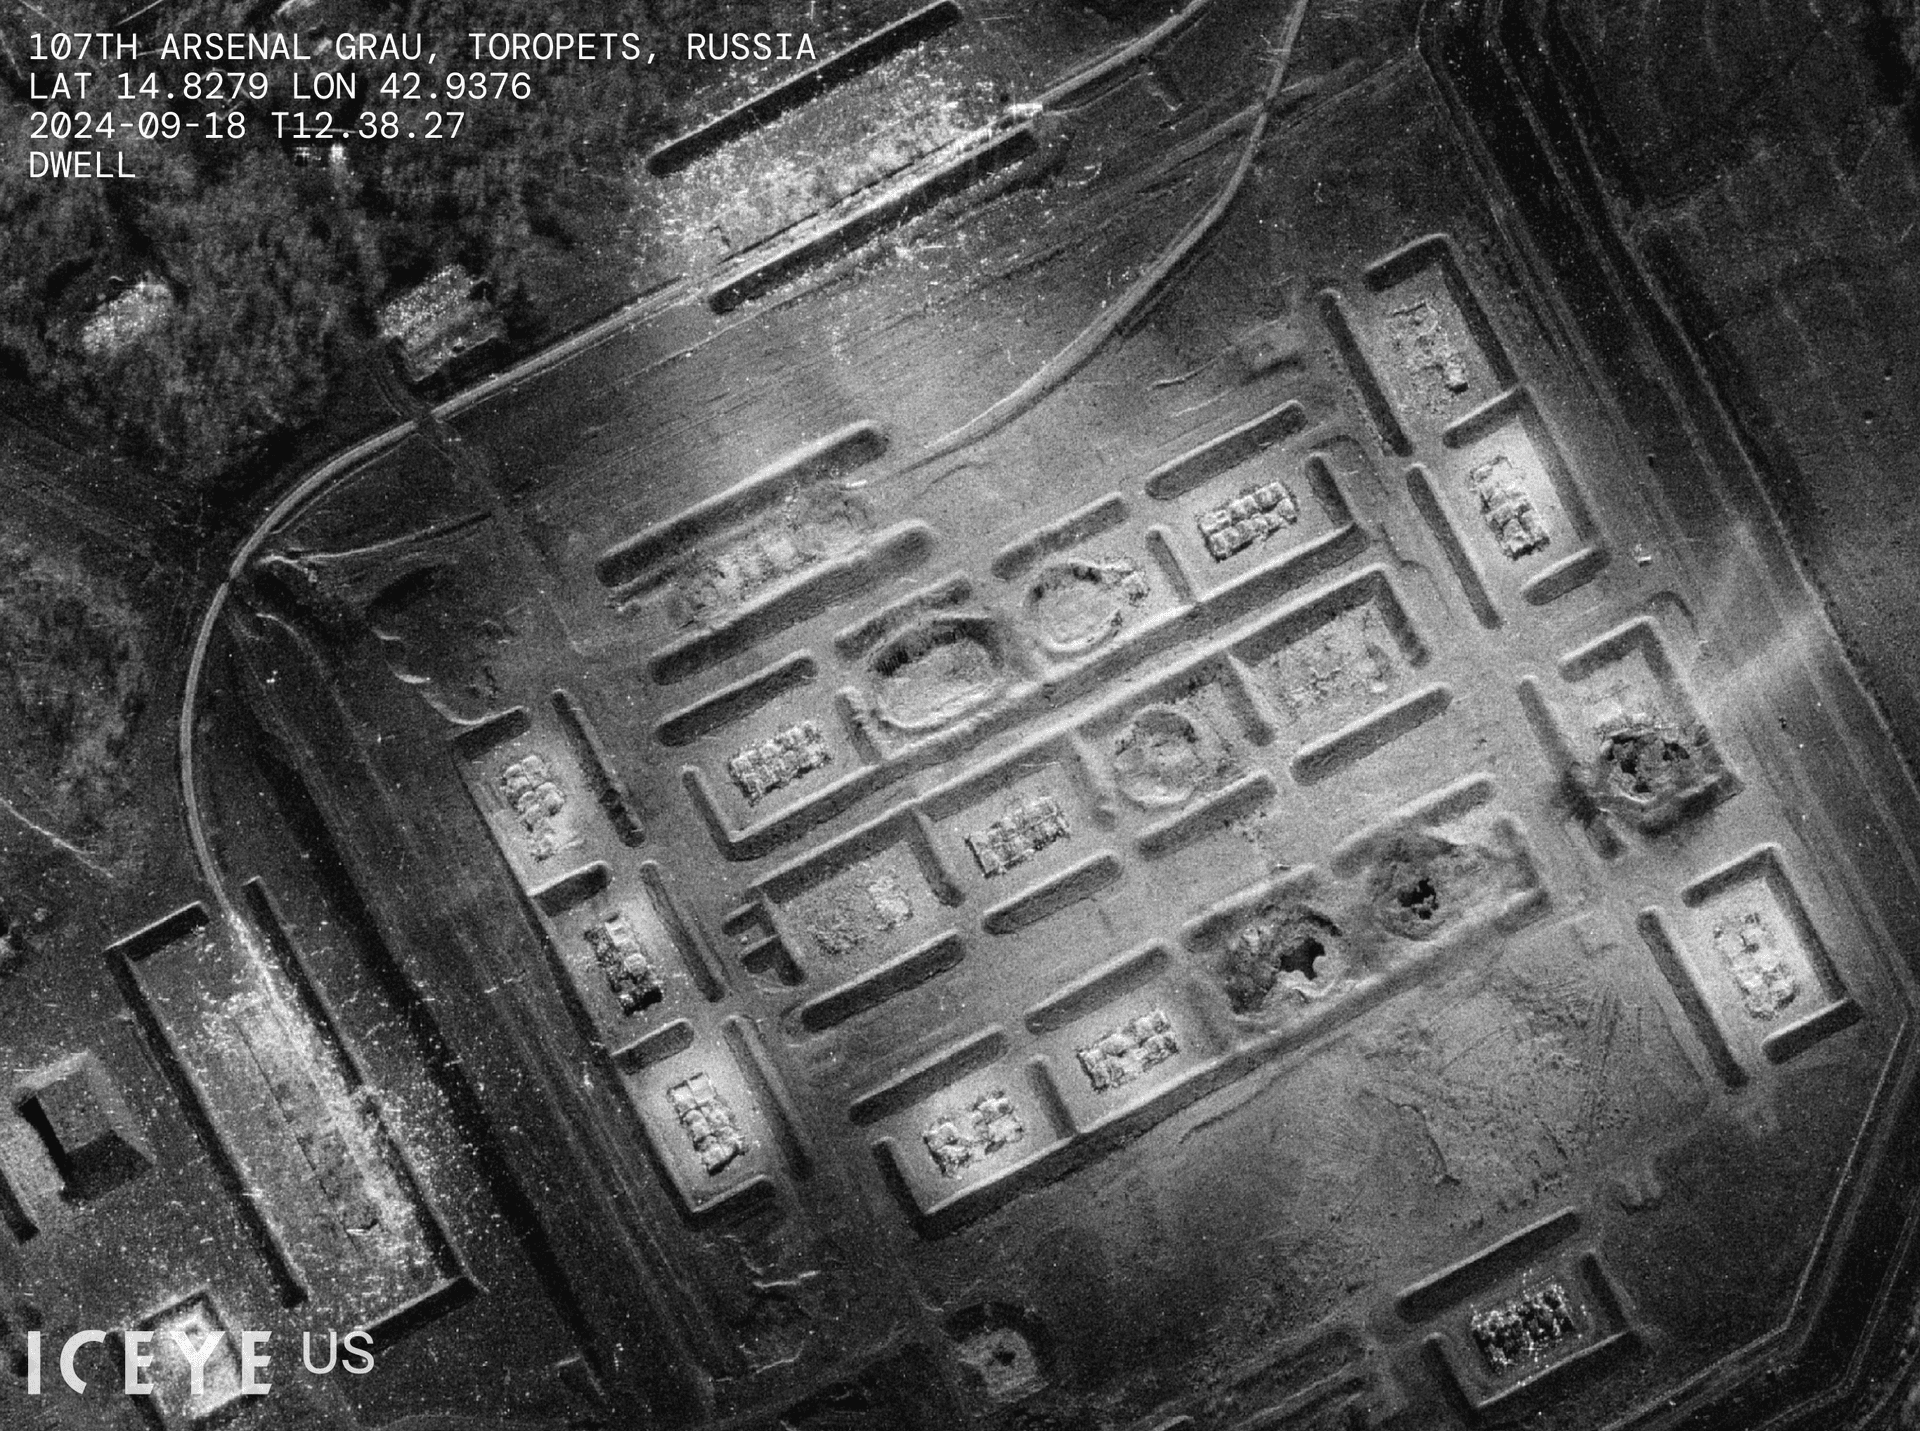
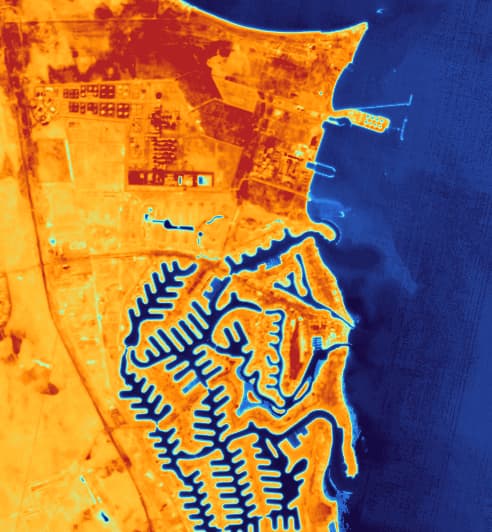
Like optical sensors, thermal sensors cannot see through clouds. Thick cloud cover blocks the surface signal and returns the temperature of the cloud tops instead. For guaranteed collection in cloudy regions, SAR remains the right complement. SkyFi's SAR imagery 101 guide explains how radar fills that gap.
Thermal Satellite Imagery Across Industries
High-resolution thermal satellite imagery adds a layer of information that optical and radar data cannot supply. Here is how organizations across SkyFi's core industries use it.
Defense and Military
Thermal imagery shows activity, not just presence. Analysts use it to spot vehicles with warm engines, generators running at remote sites, aircraft that have recently flown, and ships under way at night. SatVu's 3.5 m MWIR imagery and short thermal video clips let teams judge whether a site is active at any hour, and pairing thermal with optical and SAR builds a far more reliable picture of operations than any single sensor provides.
Construction and Real Estate
Developers, city planners, and property investors use thermal data to measure urban heat islands, compare rooftop and pavement temperatures, and identify buildings losing heat. That information supports site selection, cooling and energy-efficiency planning, and sustainability reporting for large portfolios. See how SkyFi supports construction and real estate.
Energy
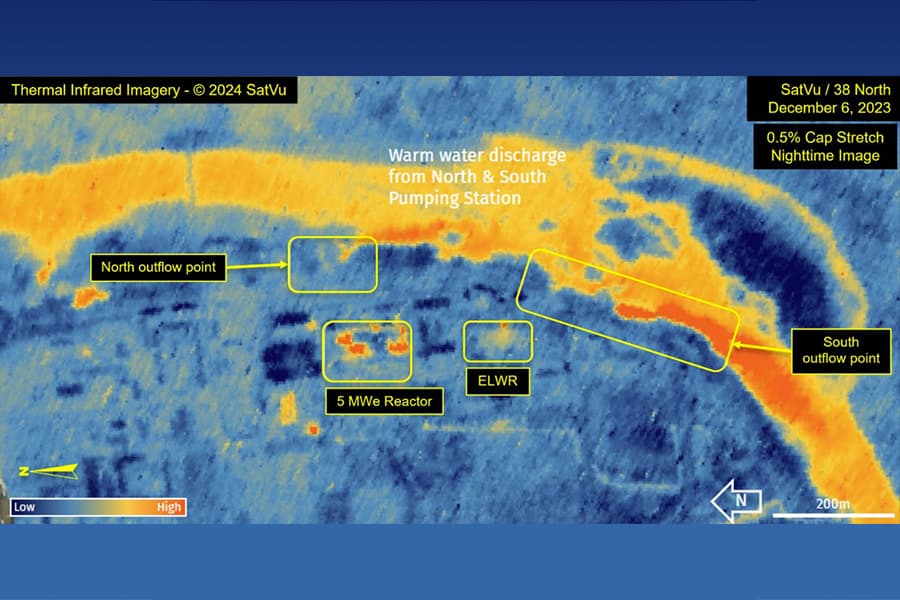
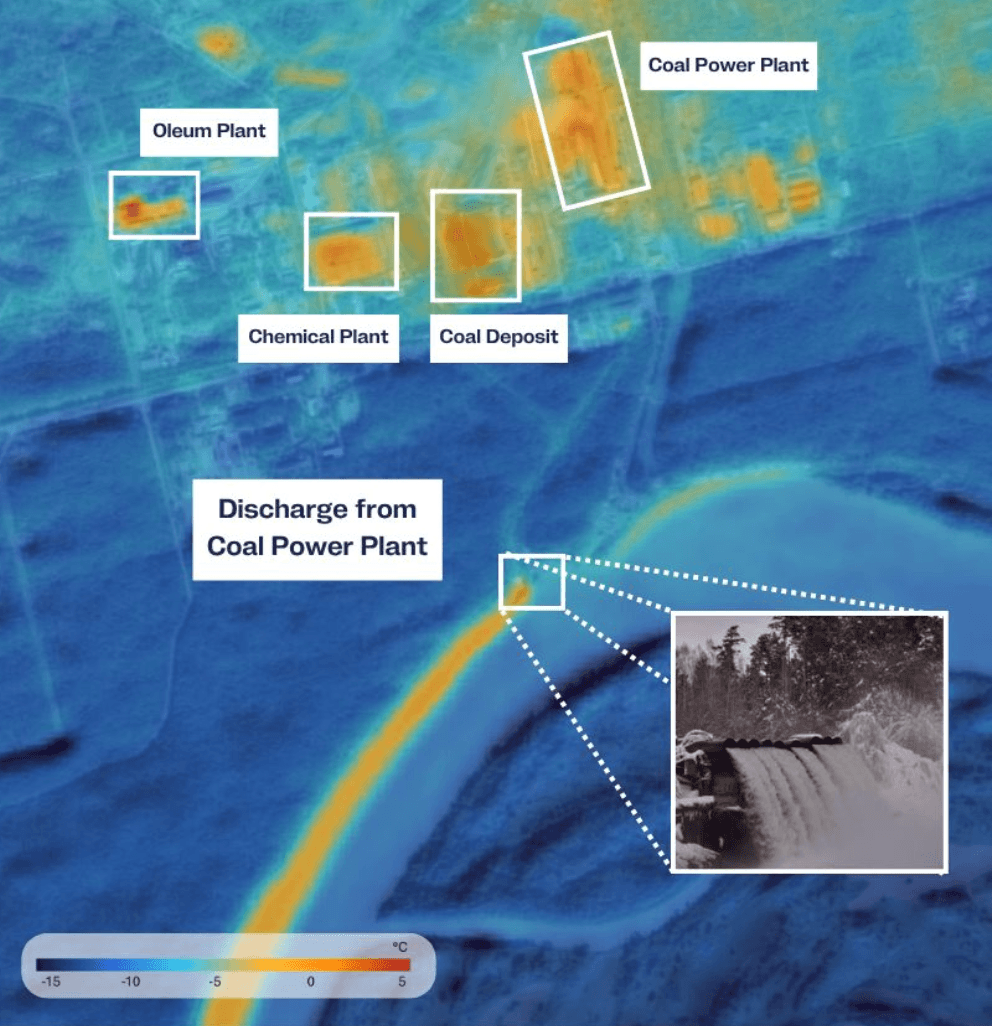
Utilities and oil and gas operators use thermal satellite imagery to monitor flare activity, cooling water discharge at power plants, substation and transformer temperatures, and pipeline corridors where a leak can change the surface temperature. Solar operators can screen large arrays for abnormal hot spots. Catching a heat anomaly early lets a team send crews before a fault becomes an outage. Read more about SkyFi for energy.
Environment
Environmental teams rely on thermal data to detect active wildfires and smoldering hot spots, map volcanic activity, measure river and lake temperatures, and trace warm industrial discharge into waterways. constellr's land surface temperature data supports long-term studies of drought, water use, and urban heat. See how SkyFi supports environmental monitoring.
Financial Services
Heat is a direct proxy for industrial output. Investors and analysts use thermal satellite imagery to see whether steel mills, refineries, power plants, and factories are running, and at what intensity, day or night. Because thermal readings do not depend on daylight or visible activity, they can confirm production at facilities that look unchanged in optical imagery. Read more about SkyFi for financial services.
Insurance
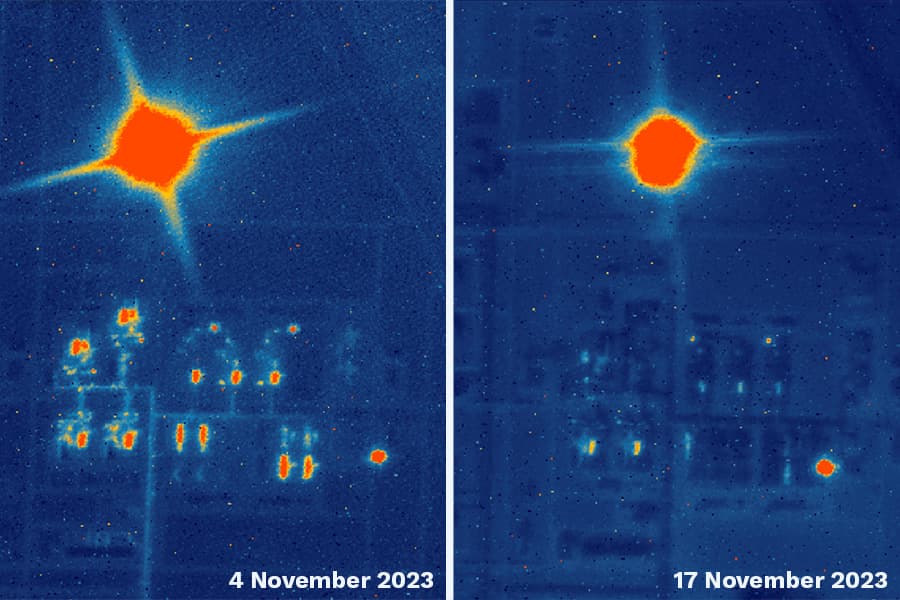
Insurers use thermal imagery to assess wildfire exposure, confirm the extent of burned areas after a fire, and identify heat-related risks at industrial and commercial properties. Thermal data can also flag hot spots that remain after a fire appears contained, which supports faster and more accurate claims decisions. See how SkyFi supports insurance.
Mining
Mining operators use thermal imagery to track equipment and processing activity, monitor smelters and kilns, detect spontaneous combustion in coal stockpiles, and watch for seepage from tailings facilities, which often shows up as a temperature difference in surface water. Read more about SkyFi for mining.
Government
Federal, state, and local agencies use thermal satellite imagery to map urban heat for public health planning, support wildfire response, manage irrigation and water rights, and monitor critical infrastructure. Self-serve ordering lets an agency respond to a heat wave or fire within a day, and the SkyFi API supports recurring monitoring programs. See how SkyFi supports government agencies.
Thermal Satellites in Remote Sensing
Thermal satellites are one layer of a larger remote sensing toolkit. Optical satellites show what a place looks like, multispectral and hyperspectral sensors can reveal what materials and vegetation are present, SAR measures structure and change through clouds and smoke, and thermal sensors measure temperature.
Thermal data is especially useful alongside vegetation analysis. NDVI shows how green and dense a crop is, while land surface temperature shows whether that crop is under water stress, often before the stress appears in NDVI. Because constellr captures thermal and visible bands together, growers and analysts can read both from one pass. See how SkyFi supports agriculture.
Free thermal sources remain a valuable baseline. Landsat 8 and 9 measure thermal infrared at 100 m, and Sentinel-3 and MODIS cover the globe at about 1 km, which works well for regional climate and ocean temperature studies. SkyFi's open data satellite imagery guide covers those sources. Commercial thermal data adds value when the question is about a specific asset, field, or neighborhood, where 3.5 m or 30 m pixels separate a single building or crop field from its surroundings.
What Makes SkyFi the Leading Platform for Thermal Satellite Imaging?
The best thermal satellites only help if their data is easy to find, buy, and combine with other sources.
One Catalog for Thermal, Optical, and SAR
SkyFi users order thermal satellite imagery from SatVu and constellr through the same self-serve interface they use for optical imagery from Vantor, Planet, and others, and SAR from ICEYE and Umbra. A user draws an area of interest once, then compares sensors side by side instead of managing separate agreements. The full list is on the SkyFi partners page.
Pay-As-You-Go Pricing
SkyFi has no contracts, subscriptions, or minimum spend. Pricing starts at $15, archive imagery typically arrives within hours, and tasked captures can be collected within 24 hours, depending on satellite availability and weather. Every price is visible before checkout on the SkyFi pricing page.
AIS Maritime Intelligence
Thermal imagery can show a vessel's engine heat at night; AIS data shows what that vessel reports about itself. SkyFi's AIS product combines satellite, terrestrial, and ship-based AIS tracking with imagery, so analysts can flag a warm hull with no AIS signal and identify vessels operating dark.
Digital Surface Models and Analytics
Digital surface models add elevation to a thermal reading, so a team can see both how hot a structure is and how tall it is, or how a stockpile's temperature relates to its volume. Combined with optical imagery and analytics such as vegetation health and building detection, thermal data becomes part of a complete site profile.
ATAK Plugin for Field Operations
The SkyFi ATAK plugin brings SkyFi imagery into the Android Team Awareness Kit, so field personnel can view current satellite data in the tool they already use.
Put Thermal Satellite Imagery to Work With SkyFi
Temperature reveals what optical images cannot: which facilities are running, which equipment is failing, which fields are stressed, and where a fire is still burning. SkyFi brings high-resolution thermal satellite imagery from SatVu and constellr into the same platform as optical and SAR data, with clear pricing and fast delivery.
Whether the need is a single thermal capture or an ongoing monitoring program, getting started takes minutes. Create a free SkyFi account to search thermal satellite imagery online for any location on Earth, or see how SkyFi serves your industry.
References: 1. Riebeek, H. (2014, March 14). Why is that forest red and that cloud blue? How to interpret a false-color satellite image. NASA Earth Observatory. https://science.nasa.gov/earth/earth-observatory/how-to-interpret-a-false-color-satellite-image/
2. Weier, J., & Herring, D. (2000, August 30). Measuring vegetation (NDVI & EVI). NASA Earth Observatory. https://science.nasa.gov/earth/earth-observatory/measuring-vegetation-ndvi-evi/
3. European Space Agency. (n.d.). Land surface temperature. ESA Knowledge Hub. https://knowledge-hub-gda.esa.int/eo_capability/land-surface-temperature/
4. European Space Agency. (2020). Taking the pulse of the planet: Teacher guide and student worksheets (lower secondary). ESA Climate Change Initiative. https://climate.esa.int/documents/632/ESA_CCI_Education_Resources_Taking_The_Pulse_Of_The_Planet_LS_Jul22.pdf